Monday 23 December 2013

Closed Trades : BTT & PTM

The recent push up in the All Ordinaries has been a welcome respite from the bearish action of the last two months. In fact, this system turned back on last Friday's close but I won't be buying anything until January. Primarily this is because the holiday period is a very illiquid time but also because personal factors mean I may not be able to trade on my own account in the foreseeable future.  I need to see how these play out before I kick off a fresh group of trades.

This morning the markets made another little push up and that was enough for BTT and PTM to hit their initial targets.  It was a nice change from my recent results but I still haven't made a new equity high since the 8th November.

BTT was trending nicely when I bought it and the price surge over the past few days was too rapid for the target to be pushed up


PTM had similar price action to BTT.  There was a prior trade here that was a loss even though the trend never really changed.  This can be one of the less desirable features of shorter term trading systems.  All one can do is keep taking the trades as they come for as long as the trend lasts and let the probabilities play out.

Charts courtesy www.IncredibleCharts.com

Wednesday 18 December 2013

Method Part 4 : Opening Trades – Entry Method - Continued

This is another entry method that works well in trending markets. I am using the 63 day moving average (Black) to define if a stock is trending. I have also placed a couple of Bollinger Bands on the chart. The upper band (Green) is at 1 standard deviation and the lower band (Red) is at 2 standard deviations of price. The middle Bollinger band (Blue) is the 20 day simple moving average of the close.

I tend to be a momentum buyer of stocks, so initially I look for a pause in the trend signified here by a close below the middle (Blue) band followed by the price taking off again, signified by a close above the upper (Green) band. Then it's simply a matter of buying the following days open, holding on for the ride until the price closes below the lower band and exiting on the following open.

Courtesy of www.IncredibleCharts.com

I mentioned before that it's hard to lose money when a stock trends as well as MFG did and this is a spectacular example. If you took the first entry and hung on to the final stop, you trebled you money which is all well and good, more importantly you made a massive return on risk and it is return on risk that ultimately defines our success as a trader. There were a few later entries in this trend, one profitable, one not. As a trader you have to decide if you should take only the first entry or any of the subsequent ones, I offer no guidance on this subject except to be consistent.

I will discuss Risk : Return later, but the one thing I urge anyone to take away from this chart is that if you take enough trades you will, from time to time, own a stock like this. When you do it's very important to just hang on and let the trend play out. It is in our nature to try to think of a reason to snatch the profit available when it looks decent enough particularly if we have had a bunch of losses recently or some scary economic events spouting out of the TV. The simple solution to this urge is Don't Do It! These trades are your wealth builders. There has never been a large profit that wasn't once a small profit.

There are endless variants on entry methods in stock trading. I am, at heart, a rules based discretionary trader so I use rules to enter and exit trades even though I can demonstrate that most of them don't really add an edge (another future post). Just now I stuck “stock trading entry methods” into Google. It returned exactly 193 million results in 0.39 of a second (a suspiciously round number, I thought.) When I Googled Exit methods there were 'only' just over 31 million results, which may be one of the reasons most people don't make money trading stocks.

If you want to learn and understand a few different styles of entry AND exits, then I would recommend reading “Unholy Grails” by Nick Radge and “The Layman’s Guide to Trading Stocks” by Dave Landry. As I mentioned before, I don't get paid for mentioning these books but having read around 100 different trading books, I can happily say these are a couple of books (and people) that I wish I had come across much earlier in my trading endeavours.


Saturday 14 December 2013

Closed Trades : ARG & VRT

System Status - Off

The Australian All Ordinaries index has fallen over 7% in practically a straight line since early November.  As a result the trades keep hitting their stops rather than profit targets.  It's not particularly pleasant but this part of the trading cycle is about capital preservation rather than piling up profits.

ARG went from a decent start to just meandering sideways for quite a while.  By the time the stop was hit the cost of carry practically chewed up the profit in the trade so even though it was marginally up it was a scratch

Courtesy of www.IncredibleCharts.com


 VRT falls into the category of "damned if you do and damned if you don't".  I use a hard stop in all my trades to keep the amount of margin used in check and to provide disaster cover should a black swan fly in.  For the stop to be meaningful in any way it has to be close enough to protect capital but ideally never be tagged under normal trading conditions.  Unfortunately VRT tagged the hard stop causing just over 1R of loss in what had been a reasonably good trade under present market conditions.


Courtesy of www.IncredibleCharts.com

I have only 4 trades currently open and even they are only hanging on by the skin of their teeth.  It's about now that one starts hoping for the Santa Rally

Wednesday 11 December 2013

Closed Trade : GEM

GEM has been a bit of a pain trade for me.  Frankly I'm glad it has gone.  I realized shortly after I had bought it that they were undertaking a rights issue at a price below my stop loss.  Even then I had a few opportunities to exit without taking too much of a loss but instead I carried on with the original plan.

There is probably some virtue in sticking to your plan through thick and thin but when the circumstances of a trade are radically altered like this I try to manage my way out of it.  Sometimes I do quite well and sometimes not.  In this instance my loss was 1.5 times the intended maximum which isn't too bad when it happens only sporadically.  If I were regularly taking losses this size I would think I had to alter my plan.  As it happens I have slightly altered my plan in the last week or so to refine the way I manage my hard stop/time stop but it would have only saved me a cent or two here and didn't alter any of my other open trades either

Chart courtesy of www.IncredibleCharts.com

Wednesday 4 December 2013

Method Part 3 : Opening Trades - Entry Methods

There is quite a bit to discuss when it comes to kicking trades off.  Indeed, there are probably more books, blogs, twitters, spams, magazine pages and acres of newsprint written on this one subject than any other aspect of trading.  Personally I think the amount of time dedicated to entering trades is disproportionate and I hope to throw light on this over the following posts but, given that, to trade - one has to enter trades, I will add my own few hundred lines on the subject to the existing morass.

In 'Method part 2' I discussed what my short list of stocks looks like. Given that I have risk limits and portfolio size limits (you can just imagine more method posts coming can't you?) how do I pick which to buy on any given day?

I think I mentioned that, as the list comprises a bunch of rising stocks, I could just toss a coin, throw a dice or use a random number generator to select one and buy it. I don't believe that any entry method offers superior returns, I don't believe that money is made on the entry at all, but, I also don't toss a coin etc. to choose stocks. Why not? Well simply because I am human I suppose, and, this means that my entry method has to match my personal beliefs about when is a good time to buy.

So rather than go into the nut's and bolt's of my entry method I will look at a few different styles and what I think each may deliver. I will start this discussion by stressing that the entry alone means nothing! I never make a trade without knowing what will cause me to close it. I cannot stress enough that I believe it is the method of closing trades that makes the money.

Now that I have become all excited with bold underlined text - lets get into it


I will start with a chart of MFG, This stock was in a fabulous up trend for a considerable period and this chart shows theoretical entries using my current method. Alas I didn't actually take these entries – I marked this chart up while I was digging around creating the method, I wasn't chucking money into it at this stage but it was almost the ideal stock for a while and I love this chart because it shows what can happen when things are going well.

Chart courtesy of www.IncredibleCharts.com

 The first alternative entry method is using an inside candle (A candle where the high and low are contained within yesterdays high and low). You can find this method all over the internet but basically it consists of finding a trending stock and buying the break above the inside candle. All I have done here is used a group of moving averages to determine that a trend exists and close below an average true range trailing stop as an exit. Lovely isn't it? Bear in mind it's hard to lose money when a stock trends like this

Chart courtesy of www.IncredibleCharts.com

   To be continued...

Friday 29 November 2013

Closed Trade : FBU

FBU is another trade that has succumbed to the malaise that has affected the XAO during November.  Yesterday it closed below the stop for the second consecutive time so I placed a hard stop in right under that price action and was closed out around about today's open.  It's another full loss (and a bit)

Chart Courtesy of www.IncredibleCharts.com

Monday 25 November 2013

Summary for Trades Opened : August 2013 & September 2013

I am now showing daily updates as trades open and close.  There is nothing special about the trades opened in August or September, they just look like more of July so I will just show the summaries

August
I opened 6 Trades - 2 wins and 4 Losses so Win Rate 33.33%
The average win was 2.28 R and Average Loss 0.59 R so Win : Loss Ratio of 3.87 : 1
Expectancy 0.37

September
I opened 11 Trades - 4 Wins and 11 Losses so Win Rate 36.36%
The average win was 1.93 R and Average Loss 0.66 R so Win : Loss Ratio of 2.94 : 1
Expectancy 0.28

The financial YTD
24 Trades - 11 Wins and 13 Losses - Win Rate 45.83%
Average win - 1.93 R and Average Loss -  0.66 R so Win : Loss Ratio of 3.16 : 1
Expectancy 0.54

So while July was abnormally good, August and September pretty much bought it back to approximately where I would expect it to be.  October still has 5 open positions and none of them have much open profit yet.  I hope I won't be able to report the October results until the remaining trades close with enormous profits.

So after the Jul, Aug and Sep blocks were all closed the distribution chart looks like this


A number of full 1 R losses and 'empty' trades have crept into the picture as the US funding crisis caused a dip in the market.  Even so the Win : Loss ratio has managed to keep the returns so far in positive territory.

Closed Trade : AAD

AAD opened at the hard stop today.  My hard stop tightens up after a given amount of time and this one picked it off.  It then tracked up closing 5% higher than the open.  These things can become annoying but one has to accept that any method has its share of odd moments.  Even though I made a small gross profit the commission and carry chipped that away as well leaving me with a small net loss.


Chart courtesy of www.IncredibleCharts.com

New Longs : BTT & PTM

I have been a bit slow opening new trades of late.  Unfortunately this is because my current longs have been slow to clear their open risk.  Even now these positions have opened up because of things hitting stops rather than taking off which would be preferable.  The XAO has practically gone nowhere for nearly two months and that type of market activity can make even the best trend trading systems look a little ugly.

However, my system is still on so when there is a space to fill I try to find the best stocks to fill it from whatever pops up on the day.

I bought BTT.   It goes Ex Div in a week so it needs to get moving or I will have to start moving stops in an ugly manner


and I'm a having another go at PTM


Charts courtesy of www.IncredibleCharts.com

Method Part 2 : The What

In Method part 1 I discussed when I would like to be in the market and when I want to be defending my capital and moving into cash.

I use a weekly close in my personal on/off trigger so let's imagine that my system has turned on at Fridays close – what happens next?

The first thing I do is filter out the ASX and pick every stock that is priced between $0.05 and $50.00 and has a minimum turnover of $400,000 a day. I am simply trying to pick up a list of stocks that I would have a reasonable chance of buying and selling without finding too many gaps in the depth of market. Being stuck in a stock once is probably once too often.  Even with these baby sized trades it can become problematic if I am not a little fussy to begin with.

I will also state up front that I trade purely from a technical perspective, I don't look at any fundamental information and, usually, I don't have any idea what the various companies I have a slice of do for a crust. Sometimes I don't know their name! Just what their ticker is and what the chart looks like will do me just fine. I know all the accountants and economists plus about 90% of financial advisers out there will be pulling out their hair and wailing and gnashing teeth about now but I have always been this way. In my opinion, fundamentals, even just watching the news, tends to cloud judgement. There are all types of mental bias in trading and knowing extra information seems to introduce a few more so I stay away from all that mumbo jumbo.

Having said that, I hear you saying, perhaps even shouting, “Hey Nick! you must have some way of choosing stocks other than turnover and price!”

Well of course I do! Once I have my basic list it's time to hit the charts. After all there are about 300 different stocks and I want to weed out what I consider to be unworthy. So I like to pop them onto a weekly chart with multiple moving averages and flip through them deleting anything I don't like the look of.

There are probably many different books and trading schools that mention multiple moving averages, The first time I came across them was reading Daryl Guppy's 'Trend Trading' and I have loved them ever since. Even though they are simply a bunch of moving averages I can happily whiz through a list of stocks and cull 100 or more at the rate of about five seconds a stock.

I want charts that look like this


Not this


Or this

The other thing I look for on the daily chart is something that looks tidy.  That's a technical term for pleasing on the eye - no big spikes or gaps, no days of zero liquidity.  It's a feel thing!

Charts courtesy of www.IncredibleCharts.com

Thursday 21 November 2013

Summary for Trades opened : July 2013

So Far I have put up charts for all the trades I have made for this system that had a July start date. I like to look at my trades in blocks, almost as a portfolio result, because I believe that trading isn't about any individual trade, rather, it is a process of accumulating trades and their distribution of results. I will discuss this, and some of the following maths, in another Method post in the near future but for now let's look at this group of trades in a couple of useful ways.

The first way is to 
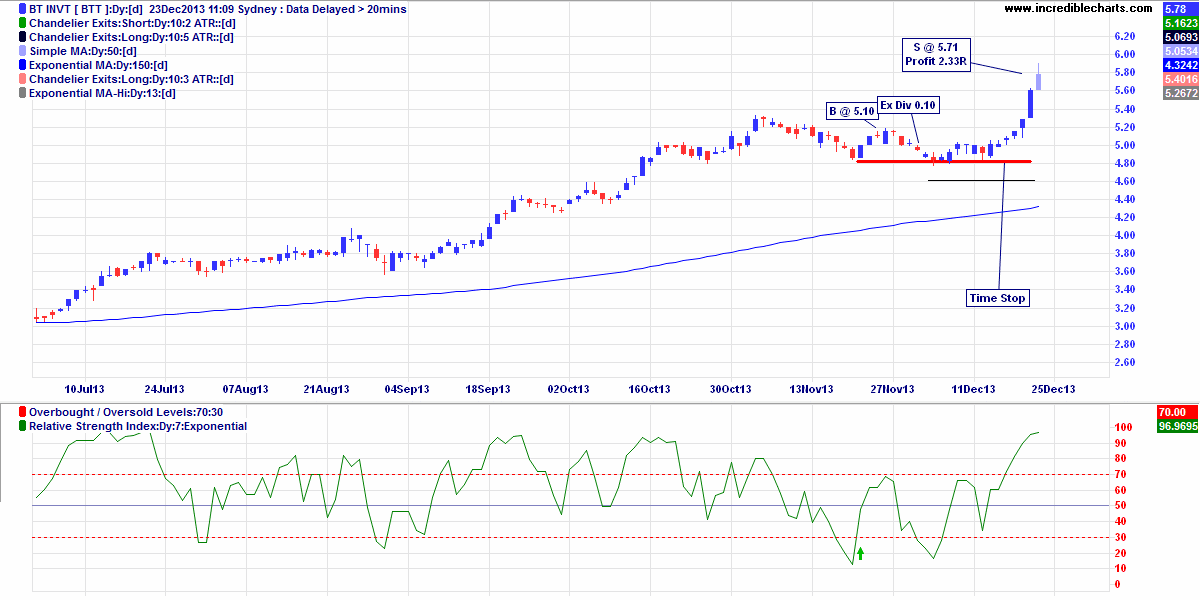
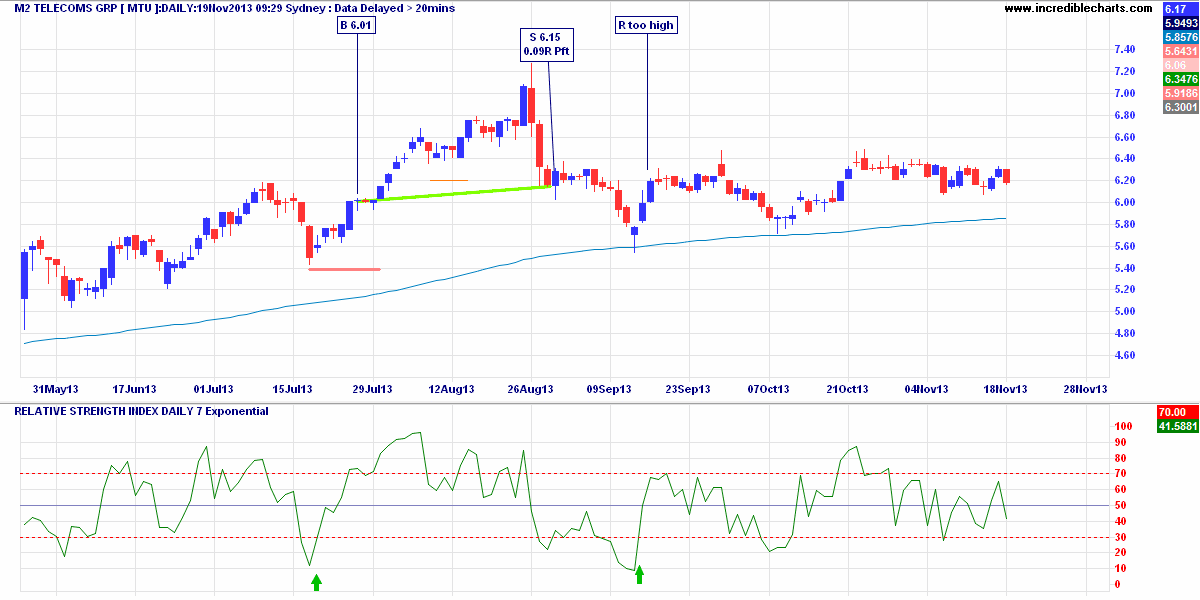
calculate the expectancy in terms of risk. There were seven trades in total in July. Each trade had a fixed amount of risk (referred to as R) and the returns shown as multiples of R were (0.50), 2.78, (0.21), 2.92, 0.09, 0.34 & 2.10

The simpler form of calculating expectancy is (Win% x Avge Win) – (Lose% x Avge Loss) so on the above numbers we had

  • 5 winners totaling 8.23R
  • 2 losers totaling 0.71R

So the expectancy is

( (5/7) x (8.23/5) ) – ( (2/7) x (0.71/2) )
=> (0.714 x 1.646) – (0.286 x 0.355)
=> 1.175 – 0.102

So Expectancy for July was = 1.07


The other useful way of looking at returns is to round each return to the nearest R and chart the distribution  


What I am looking for here is called Skewness - a measure of symmetry, or more precisely, the lack of symmetry. A distribution, or data set, is symmetric if it looks the same to the left and right of the center point. It is skewed if it bulges out to one side of center.

All my efforts in trading are aimed at creating an uneven distribution of returns with very few losses of more than 1R and many profits that push as far to the right of the bell curve as possible.

By either measure the July block of trades were stunningly good. I generally expect to hit an expectancy of between 0.5 and 1.0 and a win% of 42% - 52% over the long term but these trades were taken during a sweet spot on the ASX. It's important not to get too carried away by a small collection of trades as we will see in forthcoming posts. This number of trades isn't even statistically significant but one has to start somewhere.


Tuesday 19 November 2013

Closed Trades: MTU, SRX & CRZ

These were the last three trades I kicked off in July.  I will get these out of the way then look at some stats.

First off the rank was MTU.  At this stage I was sticking in quite ambitious targets and MTU nearly got there then bucketed.  I decided after that to narrow the target in a little because I felt like I watched a bit too much open profit disappear on this one.  Even though I had a fair idea about how I was going to apply this method I was trading it with real money to test how it worked in real life, as apposed to paper trading, so I still tweaked it for a little while.


Next came SRX - another ho hum trade


And finally CRZ - this one hit the newly narrowed in target and really hasn't done much since

All Charts courtesy of www.IncredibleCharts.com

Closed Trades: GFF & JBH

I am going to power through the closed trades a little.  I want to get up to date and start just posting trades as they happen but I also want to show all the trades on this method so that it builds a decent picture of my understanding of 'how trading works'.

First off the rank today is GFF.  It's another one of those fizzlers that my trading account is littered with.  It is worth noting that before I bought GFF it had a 6 month rate of change at 23%.  After I bought it the 6 month ROC has petered out to -6%.  I am merely trying to jump onto nice trends and take a piece of the action.  I am not attempting to predict the future, but, I like to think that if (when) I buy at the top, any decent trending stock won't burn me too much.  If all my losses were less than 0.5R I would think I was in trading paradise.


JBH is a different story.  It was rising when I bought it and just kept going eventually hitting the target.  It has kept rising since I sold it and you can see I have bought it again.  


All Charts courtesy of www.IncredibleCharts.com

Saturday 16 November 2013

Method Pt 1 : The When

Many years ago I read "Secrets for Profiting in Bull and Bear Markets" an excellent book by Stan Weinstein.  It contained practically everything anyone would need to make a decent fist of investing or trading so naturally I gave it a quick try and then moved on to the next thing when a small correction delivered me a string of losses.  One of the things I realize now is that for many years I did this and in hindsight practically ANY of the various things I tried then dumped would have delivered me a much larger bank account right now if I had only persisted with them.

In his book Mr Weinstein uses the concept of having a 30 week moving average to determine if a market is in an up trend or otherwise.  Similarly Dave Landry uses a combination of 10, 20 and 30 day moving average  in his book "A Layman's Guide to Trading Stocks"  which is another excellent investment book.

Even though I understood the concept of why it might be useful to know this it wasn't until I read Nick Radge's "Unholy Grails" that I finally understood the power of it.  In "Unholy Grails" Nick Radge discusses eight different methods of trend trading.  The mechanics of each one is described in detail and then they are tested over around 13 years of real market data to see how they perform on the ASX All Ordinaries group of stocks.  Crucially, he then tests them again but uses a 75 day moving average of the All Ords as an on/off switch for the trading system. So the system turns on and buying is allowed when the All Ords is above it's 75 day moving average and turns off, meaning no new entries and going defensive on existing held stocks, when the all Ords is Below it's 75 day moving average.

Generally the overall returns when using the index filter are smaller than when you leave the system on all the time - so what's the point?  The filter makes more sense when you measure returns, not just on absolute terms, but compared to how large a draw-down you might incur on your way to the target, and, what the standard deviation of returns in the testing was.  So an unfiltered return might be 33.59% p.a. compared to a filtered return of 29.86% but the draw-down trading the unfiltered was nearly 44% vs 33% on the filtered.  That is a massive difference,  especially when you are sitting staring at your depleted bank balance wondering if you have the intestinal fortitude to keep trading a system that is actually working perfectly well.  Personally I am a fan of using a filter - I know that sometimes I will be sitting in cash for a year or so but I am perfectly comfortable with that.

So what should you use?  Again, it depends on your own risk appetite and personal likes and dislikes. Each method has pros and cons, generally the less whipsaws in the switch the later you are to join the party and run away when the fun stops.  As an example, this is the All Ords with a 30 week (red) and 75 day (green) moving average.  You can see clearly how the red line doesn't flip on and off as often but tends to be slower to react to the big trend changes by at least a few weeks.  Also, remember you need to be looking at the index that represents the actual stocks you are trading.

Chart courtesy of www.IncredibleCharts.com


Closed Trade CGF

When I open trades, I also place a disaster stop and a profit target into the CFD platform.  The disaster stop is never intended to be taken out but it serves as a capital protection device should something negative and unexpected occur.  The target is there to catch price spikes.  If the trade moves up without too much volatility the profit target moves up with it, as does the disaster stop loss and the real stop loss.   I open and close trades at the open of the next day so the only way they otherwise disappear from my screen is from a price dump or a price jump.  Happily CGF falls into the latter of these two, even though it spent practically a month doing exactly nothing, and I banked nearly 2.8R

Charts courtesy of www.IncredibleCharts.com

Since this trade closed CGF has kept going in a very nice trend and closed at 6.13 yesterday compared to my 4.64 selling price.  This sort of thing used to drive me nuts but I realize these days that no method catches the best possible outcome of every single trade.  All any trader can do is pick the outcome that creates the least anguish.

Closed Trade TCL

I will discuss my method and the ideas around it as this blog develops and I will also post new trades and closed trades as they occur.

This was the first trade under this method - I had spent the prior few months reading all sorts of papers trying to come up with a short term system that I could live with.  There is really nothing special about it except that I finally think I have nailed down a method that suits my personality AND one that my tiny CFD account can carry.  Ultimately only time can prove me correct in this but I remain confident simply because I think the win rate and win/loss ratio are not too optimistic.

Having said that the first trade wasn't exactly a prime example - the set up wasn't quite perfect  but it could just as easily been a big winner - set ups are really just a way of filtering an entry out of a group of possible entries - they aren't the part of trading that makes the money.  I could probably take that group and buy one of them by tossing a coin or throwing a dice and still have roughly the same results - I will discuss this theory in detail later.

Here is the trade in all its lack of glory
Charts courtesy of www.IncredibleCharts.com

So  basically trade number 1 was buying TCL and watching it dither along until my time stop told me to cull it and lose 0.5R.

Thursday 14 November 2013

Disclaimer

Well of course there's a disclaimer! You see these everywhere these days because some people won't take responsibility for their own actions. They live a life based on anything that goes well is because of them but anything that goes badly must surely be someone elses fault so they rush around suing people. Soon all the beaches will have fences to stop people from drowning and footpaths will have barriers to stop people from running into the traffic. We already have warning signs on hot water taps because, strangely, they contain hot water! All this and more, simply because a few idiots won't take responsibility for their own actions and don't think before they act. It's a form of reverse Darwinism and soon the world will be full of people killing themselves simply because a sign was missing. As an aside, I live in Australia and all the signs seem to be in English yet the country has many non English speaking residents. Does that mean the people who put the signs all over the place don't care about these people? Can we expect multi lingual signs? Even then, they would have to be in around 50 different languages.

So pay attention – This blog is about my trades, thoughts on trading, my actions and my dreams (and sometimes about other things too).  It is not intended as personal or financial advice or to induce any of my millions of readers (I like to think big) to take any particular action. If you do decide that you should take some action or other based on what you see here then please remember that we are all supposed to be adults and whatever action you take is YOUR responsibility, not mine.

For my own part I will show actual trades and actual results. I am using real money for this (although probably not much by some peoples standards) and I can prove that if it comes to it. I will also rabble on about different theories and my thoughts on them. My thoughts may be spectacularly accurate or completely wrong. I have been known to be wrong in the past even spectacularly so – you have been warned! Usually in disclaimers there is a line about past results not being indicative of future performance – I hope this is true of my most momentous blunders.


I don't receive any money for mentioning any product or any person here and if I do (I live in hope) I will say so. There may be advertisements alongside my stuff on these pages and even though I may receive some revenue from them if everybody reads them and clicks on them I don't personally condone their content or otherwise. In fact I probably haven't even heard of half the advertisers.