Sunday, 26 January 2014

Final Summary (until next time)

Now that ANN is done and dusted, all the Trades opened in October are complete.  The results for October were...

I opened 10 Trades - 2 Wins and 8 Losses - Win Rate a meager 20%
Average win 0.20 R and average Loss 0.90 R
Expectancy was Negative 0.68

So October was practically as bad as a month could be.  I opened almost the maximum number of trades the system allows in one month and most of them lost practically the maximum loss.  The two winners made just enough money to buy a cheap lunch and a bottle of wine to drown my sorrows.

So what went wrong?  Surprisingly,  nothing went wrong!  These are the lumps and bumps of trading.  When the Index takes a nosedive any trend following system will manage to drag you into a few losers.  It was this phenomenon, and my desire to 'fix' it that kept me on the beginners cycle for many years.

Dave Landry, in his book 'The Layman's Guide to Trading Stocks' says that, the smarter you are, the harder trading is.  His premise is that professionals have a desire to get things right and can't accept that there can be periods where 80% of trades lose money.  All I can say is that, by that measure, I must be very smart.

These days I know full well that the solution to bad months is simply to keep going.  Soon enough a good month will come along and three or four winning trades will re-fill the coffers from the damage done by eight losers.

The overall performance of this system for the six months matched my expectations for that type of market

38 Trades - 15 wins and 23 Losses - Win rate 39.47%
Average win 1.70 R - Average loss 0.75 R - Win : Loss ration 2.27 : 1
Expectancy 0.22

I traded this with leverage of around 6 to 1 and in a period where the index only gained a little over 6 % I managed to increase my account by 18%.


I'm pretty happy with that and I intend trading this system again as soon as my personal circumstances allow.


 In the meantime I will build and give life to a new trading system from scratch right here on the world wide web.


Friday, 24 January 2014

Closed Trade : ANN

ANN was the last open trade in the KraB system and the numbers out of China yesterday were enough to slay this limping beast.

Chart Courtesy of www.IncredibleCharts.com
Click to enlarge

You can see from the chart that upward momentum didn't resume after I bought ANN and it became another loss management situation rather than the nice 'ignore the trade except for raising the target' ones that I prefer.

Wednesday, 15 January 2014

Summary for Trades Opened : November 2013

This system turned off in early November. It's important to remember that an on/off switch like this is not an attempt to predict the future. It merely keeps you out of the market during protracted down trends and lets you know when to get back in again. Sometimes it is very accurate while, at others, there will be whip-saws.

Chart Courtesy of www.IncredibleCharts.com
Click to enlarge


While in some methods the off signal is used to either bail out completely or tighten stops, that is not the case with my short term method. All it means is that I don't take any new positions.

In this instance I only opened 4 trades for November before the method switched off. The 4 are now all closed while I still have one live trade remaining that opened in October. This is why I am reporting November first.

So, in November
I opened 4 Trades – 2 wins and 2 losses – win rate 50%
Average win 2.29R average Loss 1.16R so win : Loss Ratio of 1.98 : 1
Expectancy 0.57

The October trades haven't been very profitable so far and I don't think the last trade will rescue them, but that is simply how trading works. One should never venture into this arena expecting a nice straight equity curve.

This is the distribution of returns for all trades except the lone open trade.  That trade is mildly in profit at the moment but going nowhere fast.  When it finally closes I will update this


The important thing to note here, is that even though the loss side of the distribution is far more crowded than the profit side, this period is profitable over all.  Trading isn't about picking winners so much as managing losers and leaving the winners alone to do their thing.  This is why trading is simple but it isn't easy.

Tuesday, 7 January 2014

Closed Trade : TGR

My rule for the stop Losses, is that it takes two closes below my stop to close a trade, but after 16 days I want to place a hard stop with the broker at the initial stop loss point from when I placed the trade.  Generally in a decent market any good trade will not hit that point after it has been running for 16 days, so it's just another way of weeding out the baddies.  TGR falls into the category of black hat wearing bad guys!

This trade can best be described as 'difficult'.  TGR was in a decent trend when I bought it, but the overall decline in the index dragged TGR into sideways action.  The day prior to having the hard stop placed with the broker TGR had a big decline.  

I placed my hard stop at the low of that day which was well below anything that might be considered optimal.   TGR then dragged along for a further month and a half or so but was positive enough that I was able to grind the hard stop up to the initial stop position.  This almost immediately tagged. Unfortunately by the time I allowed for the cost of carry, the loss was 1.22 R rather than 1.0 R

Chart courtesy of www.IncredibleCharts.com
click to enlarge
That was the last of the four trades I opened in November, so now I can calculate the November results.

I have just one trade open which I bought in October (ANN_AX).  I mentioned elsewhere that personal circumstances mean I can't continue trading this method at this time so I intend paper trading a fully disclosed trend trading model to continue the blog for the immediate future - watch this space!

Monday, 23 December 2013

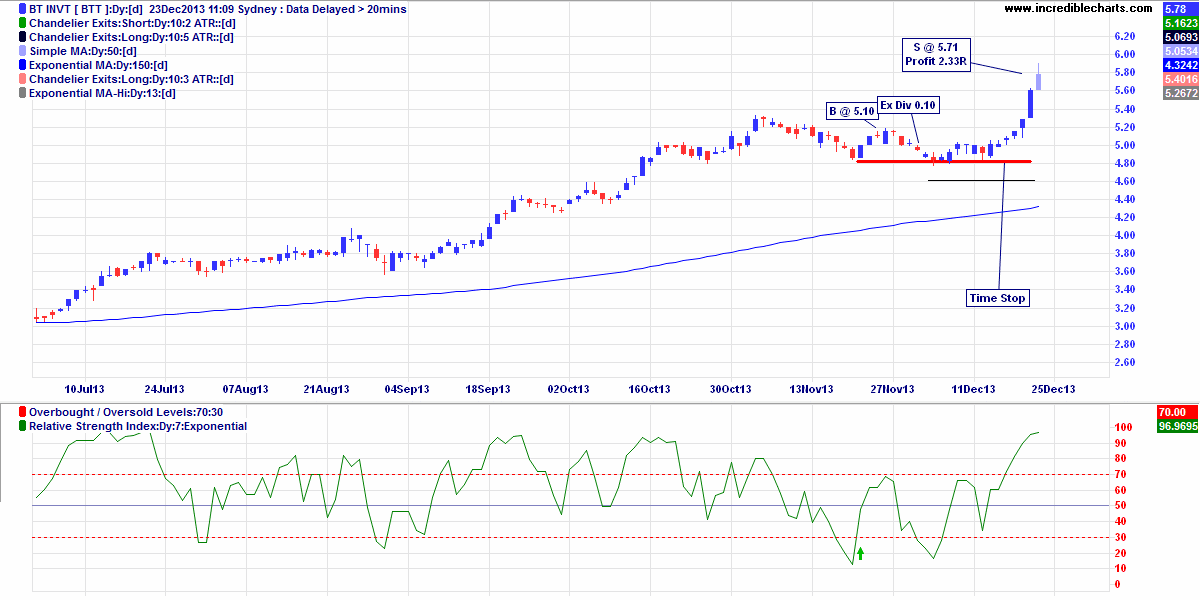
Closed Trades : BTT & PTM

The recent push up in the All Ordinaries has been a welcome respite from the bearish action of the last two months. In fact, this system turned back on last Friday's close but I won't be buying anything until January. Primarily this is because the holiday period is a very illiquid time but also because personal factors mean I may not be able to trade on my own account in the foreseeable future.  I need to see how these play out before I kick off a fresh group of trades.

This morning the markets made another little push up and that was enough for BTT and PTM to hit their initial targets.  It was a nice change from my recent results but I still haven't made a new equity high since the 8th November.

BTT was trending nicely when I bought it and the price surge over the past few days was too rapid for the target to be pushed up


PTM had similar price action to BTT.  There was a prior trade here that was a loss even though the trend never really changed.  This can be one of the less desirable features of shorter term trading systems.  All one can do is keep taking the trades as they come for as long as the trend lasts and let the probabilities play out.

Charts courtesy www.IncredibleCharts.com

Wednesday, 18 December 2013

Method Part 4 : Opening Trades – Entry Method - Continued

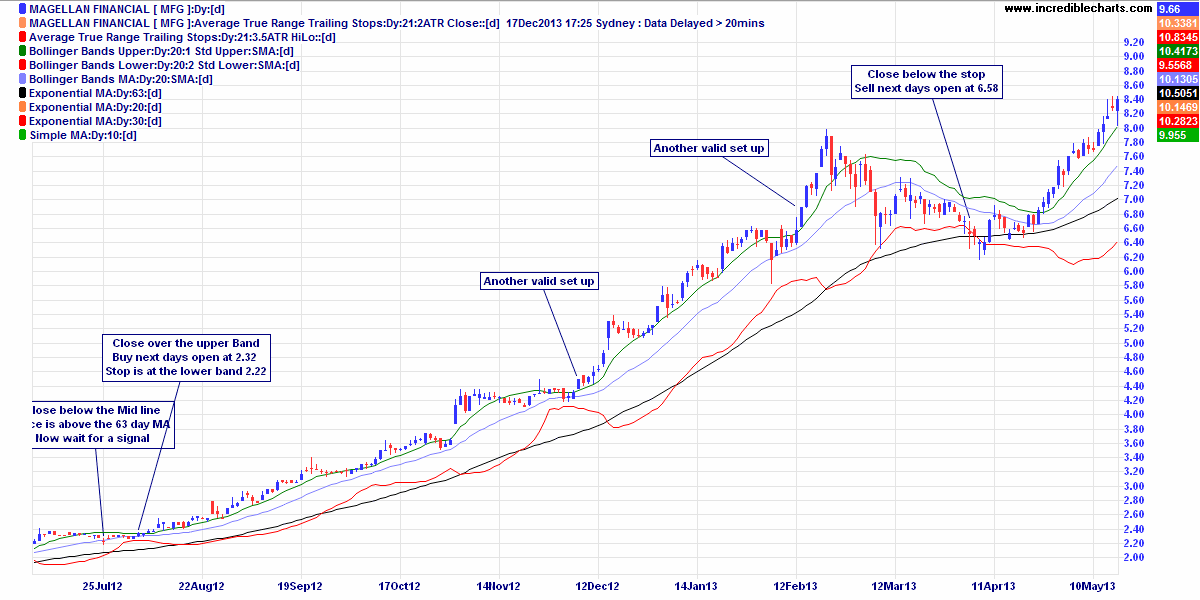
This is another entry method that works well in trending markets. I am using the 63 day moving average (Black) to define if a stock is trending. I have also placed a couple of Bollinger Bands on the chart. The upper band (Green) is at 1 standard deviation and the lower band (Red) is at 2 standard deviations of price. The middle Bollinger band (Blue) is the 20 day simple moving average of the close.

I tend to be a momentum buyer of stocks, so initially I look for a pause in the trend signified here by a close below the middle (Blue) band followed by the price taking off again, signified by a close above the upper (Green) band. Then it's simply a matter of buying the following days open, holding on for the ride until the price closes below the lower band and exiting on the following open.

Courtesy of www.IncredibleCharts.com

I mentioned before that it's hard to lose money when a stock trends as well as MFG did and this is a spectacular example. If you took the first entry and hung on to the final stop, you trebled you money which is all well and good, more importantly you made a massive return on risk and it is return on risk that ultimately defines our success as a trader. There were a few later entries in this trend, one profitable, one not. As a trader you have to decide if you should take only the first entry or any of the subsequent ones, I offer no guidance on this subject except to be consistent.

I will discuss Risk : Return later, but the one thing I urge anyone to take away from this chart is that if you take enough trades you will, from time to time, own a stock like this. When you do it's very important to just hang on and let the trend play out. It is in our nature to try to think of a reason to snatch the profit available when it looks decent enough particularly if we have had a bunch of losses recently or some scary economic events spouting out of the TV. The simple solution to this urge is Don't Do It! These trades are your wealth builders. There has never been a large profit that wasn't once a small profit.

There are endless variants on entry methods in stock trading. I am, at heart, a rules based discretionary trader so I use rules to enter and exit trades even though I can demonstrate that most of them don't really add an edge (another future post). Just now I stuck “stock trading entry methods” into Google. It returned exactly 193 million results in 0.39 of a second (a suspiciously round number, I thought.) When I Googled Exit methods there were 'only' just over 31 million results, which may be one of the reasons most people don't make money trading stocks.

If you want to learn and understand a few different styles of entry AND exits, then I would recommend reading “Unholy Grails” by Nick Radge and “The Layman’s Guide to Trading Stocks” by Dave Landry. As I mentioned before, I don't get paid for mentioning these books but having read around 100 different trading books, I can happily say these are a couple of books (and people) that I wish I had come across much earlier in my trading endeavours.


Saturday, 14 December 2013

Closed Trades : ARG & VRT

System Status - Off

The Australian All Ordinaries index has fallen over 7% in practically a straight line since early November.  As a result the trades keep hitting their stops rather than profit targets.  It's not particularly pleasant but this part of the trading cycle is about capital preservation rather than piling up profits.

ARG went from a decent start to just meandering sideways for quite a while.  By the time the stop was hit the cost of carry practically chewed up the profit in the trade so even though it was marginally up it was a scratch

Courtesy of www.IncredibleCharts.com


 VRT falls into the category of "damned if you do and damned if you don't".  I use a hard stop in all my trades to keep the amount of margin used in check and to provide disaster cover should a black swan fly in.  For the stop to be meaningful in any way it has to be close enough to protect capital but ideally never be tagged under normal trading conditions.  Unfortunately VRT tagged the hard stop causing just over 1R of loss in what had been a reasonably good trade under present market conditions.


Courtesy of www.IncredibleCharts.com

I have only 4 trades currently open and even they are only hanging on by the skin of their teeth.  It's about now that one starts hoping for the Santa Rally