Saturday 29 October 2016

Stocks: 31st October 2016

Disclaimer - Read this first!

This is not a signal service. While endeavoring to post signals before time occasionally I will only be able to post signals a day or two late

I am not a financial adviser. Some of these are paper trades. I am not suggesting you follow these signals. If you take any action based on my blog you do so at your own risk.


Easy Share Trading System

System Status: OFF (As at 31 October 2016) No new positions. Trailing stops are approx 25% of the most recent high.

System details

  1. Only trade the Top 300 shares on the ASX and put 10% of your money in each stock.
  2. Select stocks priced between 10 cents and 20 dollars - theoretical price leverage.
  3. Buy the stock if it makes a 50 week high. For example: Friday's close is higher than last Friday's 50 week upper Donchian Channel That's the buy signal. If there is more than one stock that week making a 50 week high, pick the cheapest one.
  4. Sell the stock if it at any time since it's highest recent price it falls more than 25%. For example: If you buy the stock at $2, and it rises to $4 but then falls 25% to $3, you sell. This is called the 25% Stop Loss Rule.
  5. Now re-employ that money into another stock that is making a 1-year high and use the same rules as 1 to 4.
  6. Any purchase should have a minimum $500,000 a day turnover for my trading size.
  7. Use XAO_AX Daily EMA 20 and Daily EMA 30 as an on off switch. This should smooth the equity curve even though it will probably also reduce returns a little.

Opening Stock Trades

  • Nil

Closing Stock Trades

  • Nil

Weekly Momentum System

System Status: OFF (As at 31 Octember 2016) No new positions. Stop Loss either a weekly close below the 100 day SMA on the WEEKLY chart, or, a spike above 7% in the 2 day volatility on the daily chart.

Opening Stock Trades

  • Nil

Closing Stock Trades

  • Sell A2M on Monday's open - 100 day SMA stop
  • Sell HSN on Monday's open - 100 day SMA stop
  • MYX closed last Monday

Chart(s) of the day

Nil

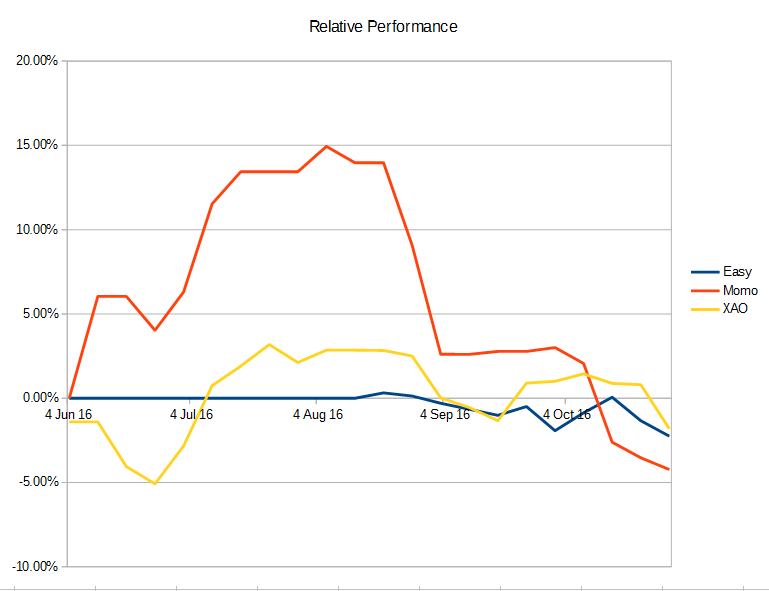
End of month performance comparison

Equity Chart

I have combined both systems into one chart in order to gauge relative performance. Naturally with the Easy system starting later than the Momo system there is a little lag there but not enough to make it bothersome over the long run.

Easy System

Momo System

Further Information


Disclosure - Personal Interests: CWY, GDI, KAR, MLD, MYR, SIP, SXL, APO, FBU, GMA, GUD, NAN, SDF


All Stock charts courtesy of www.IncredibleCharts.com


** EASY system based on Peter Castle's http://EasyShareTradingSystems.com.au site. I can't directly endorse his approach simply because I don't have the facility to back test his methods but, to me at least, they make a lot of sense. The same is true for the Momo system which is based on Andreas Clenow's book. (note: I do not receive any benefit from promoting Peter Castle, Nick Radge, Dave Landry, Andreas F Clenow, Incredible Charts or anything else.)

Monday 24 October 2016

Stocks: 24th October 2016

Disclaimer - Read this first!

This is not a signal service. While endeavoring to post signals before time occasionally I will only be able to post signals a day or two late

I am not a financial adviser. Some of these are paper trades. I am not suggesting you follow these signals. If you take any action based on my blog you do so at your own risk.


Easy Share Trading System

System Status: ON (As at 10 OCT 2016) Take new positions. Trailing stops are approx 25% of the most recent high.

System details

  1. Only trade the Top 300 shares on the ASX and put 10% of your money in each stock.
  2. Select stocks priced between 10 cents and 20 dollars - theoretical price leverage.
  3. Buy the stock if it makes a 50 week high. For example: Friday's close is higher than last Friday's 50 week upper Donchian Channel That's the buy signal. If there is more than one stock that week making a 50 week high, pick the cheapest one.
  4. Sell the stock if it at any time since it's highest recent price it falls more than 25%. For example: If you buy the stock at $2, and it rises to $4 but then falls 25% to $3, you sell. This is called the 25% Stop Loss Rule.
  5. Now re-employ that money into another stock that is making a 1-year high and use the same rules as 1 to 4.
  6. Any purchase should have a minimum $500,000 a day turnover for my trading size.
  7. Use XAO_AX Daily EMA 20 and Daily EMA 30 as an on off switch. This should smooth the equity curve even though it will probably also reduce returns a little.

Opening Stock Trades

  • Buy KAR on Monday's open

Closing Stock Trades

  • Nil

Weekly Momentum System

System Status: ON - as at 10 Oct 2016 - Portfolio re-balanced monthly, positions checked weekly. Stop Loss either a weekly close below the 100 day SMA on the WEEKLY chart, or, a spike above 7% in the 2 day volatility on the daily chart.

Opening Stock Trades

  • Nil

Closing Stock Trades

  • Sell MYX on Monday's open - 100 day SMA stop
  • BAL, BAP, NXT & SIQ closed last Monday

Chart(s) of the day

Nil

Further Information


Disclosure - Personal Interests: CWY, GDI, MLD, MYR, SIP, SXL, APO, FBU, GMA, GUD, NAN, SDF


All Stock charts courtesy of www.IncredibleCharts.com


** EASY system based on Peter Castle's http://EasyShareTradingSystems.com.au site. I can't directly endorse his approach simply because I don't have the facility to back test his methods but, to me at least, they make a lot of sense. The same is true for the Momo system which is based on Andreas Clenow's book. (note: I do not receive any benefit from promoting Peter Castle, Nick Radge, Dave Landry, Andreas F Clenow, Incredible Charts or anything else.)

Saturday 15 October 2016

Stocks: 17th October 2016

Disclaimer - Read this first!

This is not a signal service. While endeavoring to post signals before time occasionally I will only be able to post signals a day or two late

I am not a financial adviser. Some of these are paper trades. I am not suggesting you follow these signals. If you take any action based on my blog you do so at your own risk.


Easy Share Trading System

System Status: ON (As at 10 OCT 2016) Take new positions. Trailing stops are approx 25% of the most recent high.

System details

  1. Only trade the Top 300 shares on the ASX and put 10% of your money in each stock.
  2. Select stocks priced between 10 cents and 20 dollars - theoretical price leverage.
  3. Buy the stock if it makes a 50 week high. For example: Friday's close is higher than last Friday's 50 week upper Donchian Channel That's the buy signal. If there is more than one stock that week making a 50 week high, pick the cheapest one.
  4. Sell the stock if it at any time since it's highest recent price it falls more than 25%. For example: If you buy the stock at $2, and it rises to $4 but then falls 25% to $3, you sell. This is called the 25% Stop Loss Rule.
  5. Now re-employ that money into another stock that is making a 1-year high and use the same rules as 1 to 4.
  6. Any purchase should have a minimum $500,000 a day turnover for my trading size.
  7. Use XAO_AX Daily EMA 20 and Daily EMA 30 as an on off switch. This should smooth the equity curve even though it will probably also reduce returns a little.

Opening Stock Trades

  • Buy MLD on Monday's open

Closing Stock Trades

  • Nil

Weekly Momentum System

System Status: ON - as at 10 Oct 2016 - Portfolio re-balanced monthly, positions checked weekly. Stop Loss either a weekly close below the 100 day SMA on the WEEKLY chart, or, a spike above 7% in the 2 day volatility on the daily chart.

Opening Stock Trades

  • Nil

Closing Stock Trades

  • Sell BAL on Monday's open - 100 day SMA stop
  • Sell BAP on Monday's open - 100 day SMA stop
  • Sell NXT on Monday's open - 100 day SMA stop
  • Sell SIQ on Monday's open - 100 day SMA stop
  • BSL & RRL closed last Monday

Chart(s) of the day

Nil

Further Information


Disclosure - Personal Interests: CWY, GDI, MYR, SIP, SXL, APO, FBU, GMA, GUD, NAN, SDF, SXL


All Stock charts courtesy of www.IncredibleCharts.com


** EASY system based on Peter Castle's http://EasyShareTradingSystems.com.au site. I can't directly endorse his approach simply because I don't have the facility to back test his methods but, to me at least, they make a lot of sense. The same is true for the Momo system which is based on Andreas Clenow's book. (note: I do not receive any benefit from promoting Peter Castle, Nick Radge, Dave Landry, Andreas F Clenow, Incredible Charts or anything else.)

Saturday 8 October 2016

Stocks: 10th October 2016

Disclaimer - Read this first!

This is not a signal service. While endeavoring to post signals before time occasionally I will only be able to post signals a day or two late

I am not a financial adviser. Some of these are paper trades. I am not suggesting you follow these signals. If you take any action based on my blog you do so at your own risk.


Easy Share Trading System

System Status: ON (As at 10 OCT 2016) Take new positions. Trailing stops are approx 25% of the most recent high.

System details

  1. Only trade the Top 300 shares on the ASX and put 10% of your money in each stock.
  2. Select stocks priced between 10 cents and 20 dollars - theoretical price leverage.
  3. Buy the stock if it makes a 1 year high. For example: Friday's close is higher than last Friday's 50 week upper Donchian Channel That's the buy signal. If there is more than one stock that week making a 50 week high, pick the cheapest one.
  4. Sell the stock if it at any time since it's highest recent price it falls more than 25%. For example: If you buy the stock at $2, and it rises to $4 but then falls 25% to $3, you sell. This is called the 25% Stop Loss Rule.
  5. Now re-employ that money into another stock that is making a 1-year high and use the same rules as 1 to 4.
  6. Any purchase should have a minimum $500,000 a day turnover for my trading size.
  7. Use XAO_AX Daily EMA 20 and Daily EMA 30 as an on off switch. This should smooth the equity curve even though it will probably also reduce returns a little.

Opening Stock Trades

  • Buy SIP on Monday's open

Closing Stock Trades

  • Nil

Weekly Momentum System

System Status: ON - as at 10 Oct 2016 - Portfolio re-balanced monthly, positions checked weekly. Stop Loss either a weekly close below the 100 day SMA on the WEEKLY chart, or, a spike above 7% in the 2 day volatility on the daily chart.

Opening Stock Trades

  • Buy A2M, MYX, FMG, IPD, HSN, SIP and NXT as per the spreadsheet.
  • Adjust SIQ, ALU and TWE as per the spreadsheet.

Closing Stock Trades

  • Sell entire BSL position Monday's open - No longer in the top momentum ranks
  • Sell entire RRL position Monday's open - 100 day SMA stop
  • DMP closed last Monday - 100 day SMA stop

Chart(s) of the day

Nil.

Further Information


Disclosure - Personal Interests: CWY, GDI, MYR, ALU, APO, FBU, GMA, GUD, NAN, SDF, SIP, SXL


All Stock charts courtesy of www.IncredibleCharts.com


** EASY system based on Peter Castle's http://EasyShareTradingSystems.com.au site. I can't directly endorse his approach simply because I don't have the facility to back test his methods but, to me at least, they make a lot of sense. The same is true for the Momo system which is based on Andreas Clenow's book. (note: I do not receive any benefit from promoting Peter Castle, Nick Radge, Dave Landry, Andreas F Clenow, Incredible Charts or anything else.)

Monday 3 October 2016

Stocks: 3rd October 2016

Disclaimer - Read this first!

This is not a signal service. While endeavoring to post signals before time occasionally I will only be able to post signals a day or two late

I am not a financial adviser. Some of these are paper trades. I am not suggesting you follow these signals. If you take any action based on my blog you do so at your own risk.


Easy Share Trading System

System Status: OFF (As at 11 September 2016) No new positions. Trailing stops are approx 25% of the most recent high.

System details
  1. Only trade the Top 300 shares on the ASX and put 10% of your money in each stock.
  2. Select stocks priced between 10 cents and 20 dollars - theoretical price leverage.
  3. Buy the stock if it makes a 1 year high. For example: Friday's close is higher than last Friday's 50 week upper Donchian Channel That's the buy signal. If there is more than one stock that week making a 50 week high, pick the cheapest one.
  4. Sell the stock if it at any time since it's highest recent price it falls more than 25%. For example: If you buy the stock at $2, and it rises to $4 but then falls 25% to $3, you sell. This is called the 25% Stop Loss Rule.
  5. Now re-employ that money into another stock that is making a 1-year high and use the same rules as 1 to 4.
  6. Any purchase should have a minimum $500,000 a day turnover for my trading size.
  7. Use XAO_AX Daily EMA 20 and Daily EMA 30 as an on off switch. This should smooth the equity curve even though it will probably also reduce returns a little.

Opening Stock Trades

  • Nil

Closing Stock Trades

  • Nil

It is very early days with this system. So far it has been on just long enough to pick up 4 stocks then turned off. Here is the current spreadsheet.

Weekly Momentum System

System Status: OFF (As at 11 September 2016) No new positions. Stop Loss either a weekly close below the 100 day SMA on the WEEKLY chart, or, a spike above 7% in the 2 day volatility on the daily chart.

Opening Stock Trades

  • Nil

Closing Stock Trades

  • Sell DMP on Monday's open - 100 day SMA stop

With the system off falling or stagnant stocks are effectively turning the portfolio back to cash. DMP is still in at Friday's close

Equity Chart

I have combined both systems into one chart in order to gauge relative performance. Naturally with the Easy system starting later than the Momo system there is a little lag there but not enough to make it bothersome over the long run.

Further Information


Disclosure - Personal Interests: CWY, GDI, MYR, ALU, APO, CHC, FBU, GMA, GUD, MQA, NAN, SDF, SIP, SXL


All Stock charts courtesy of www.IncredibleCharts.com


** WETT Trading style is Similar to the methodology described in 'The Weekend Trend Trader' by Nick Radge, Buy his book if you wish to discover how I am generating these signals (note: I do not receive any benefit from promoting Nick Radge, Dave Landry, Andreas F Clenow, Incredible Charts or anything else.)

Stocks: 26th September 2016

Disclaimer - Read this first!

This is not a signal service. While endeavoring to post signals before time occasionally I will only be able to post signals a day or two late

I am not a financial adviser. Some of these are paper trades. I am not suggesting you follow these signals. If you take any action based on my blog you do so at your own risk.


Easy Share Trading System

System Status: OFF (As at 11 September 2016) No new positions. Trailing stops are approx 25% of the most recent high.

System details

  1. Only trade the Top 300 shares on the ASX and put 10% of your money in each stock.
  2. Select stocks priced between 10 cents and 20 dollars, Theory is they go up more quickly than more expensive stocks and yes there are plenty of stocks in that price range in the ASX 300.
  3. Buy the stock if it makes a 1 year high. For example: This weeks closing price of $2 is the highest the stock has been for 50 Weeks; That is the buy signal. If there is more than one stock that week making a 1 year high, pick the cheapest one.
  4. Sell the stock if, it at any time since it's highest recent price it falls more than 25%. For example: If you buy the stock at $2, and it rises to $4 but then falls 25% to $3, you sell. This is called the 25% Stop Loss Rule.
  5. Now re-employ that money into another stock that is making a 1-year high and use the same rules as 1 to 4.
  6. Any purchase should have a minimum $500,000 a day turnover for my trading size.
  7. Use XAO_AX EMA 20 and EMA 30 as an on off switch. This should smooth the equity curve even though it will probably also reduce returns a little.

Opening Stock Trades

  • Nil

Closing Stock Trades

  • Nil

Weekly Momentum System

System Status: OFF (As at 11 September 2016) No new positions. Stop Loss either a weekly close below the 100 day SMA on the WEEKLY chart, or, a spike above 7% in the 2 day volatility on the daily chart.

Opening Stock Trades

  • Nil

Closing Stock Trades

  • Nil

Chart(s) of the day

SIQ - One of the original trades in the momo system. Currently up over 20% and ticking along nicely. Where will it go? Well we can't know that so all we can do is honor our stops when the time comes and, otherwise, watch and wait.

Further Information


Disclosure - Personal Interests: CWY, GDI, MYR, ALU, APO, CHC, FBU, GUD, MQA, NAN, SDF, SIP, SXL


All Stock charts courtesy of www.IncredibleCharts.com


** EASY system based on Peter Castle's http://EasyShareTradingSystems.com.au site. I can't directly endorse his approach simply because I don't have the facility to back test his methods but, to me at least, they make a lot of sense. The same is true for the Momo system which is based on Andreas Clenow's book. (note: I do not receive any benefit from promoting Peter Castle, Nick Radge, Dave Landry, Andreas F Clenow, Incredible Charts or anything else.)